

Uncertainty communication
Scientific assessments of complex environmental risks, and policy responses to those risks, involve uncertainties of many sorts. These uncertainties can be present in various stages of the policy cycle, ranging from the initial detection of a (possible) problem, to policy formulation and, eventually, monitoring and adjustments to existing policies. More research will not necessarily reduce uncertainty and decisions often need to be made before conclusive evidence is available. Meanwhile, the potential impacts of wrong decisions on, for instance, health, economy, environment and credibility can be huge.
Communication of uncertainties aimed at policymakers, as well as other parties involved in policymaking, is important because uncertainties can influence the policy strategy that is selected. Furthermore, it is a matter of good scientific practice, accountability and openness towards the general public. The question of how to deal with ‘deep’ uncertainties and limits to its quantification is central in several fields which aim to improve the science-policy and science-society interfaces. These fields are evolving around different concepts and notions, such as complexity, resilience, post-normal science, trans-disciplinarity and the precautionary principle.
However, many scientists believe that the general public is unable to conceptualise uncertainties and that providing the public with information on uncertainty would increase distrust in science and cause panic and confusion regarding the risk. In contrast, focus groups with citizens have shown that citizens in such a group context can take part in differentiated debates about complex environmental issues that are blurred by uncertainties. Furthermore, psychological studies revealed no average change in perceived risk when providing uncertainty information (although, for example, some forms of presentation made it easier for people to either refute a risk or justify heightened concern).
However, clear and responsible communication on uncertainties, whether addressed to professional policymakers or the general public, is difficult and not always appreciated. The interest of target audiences often seems limited or variable over issues and time. Uncertainty information is often considered difficult to understand, and strategic use is possible (people may use it merely to further their personal goals, for example, by ignoring/trivialising or emphasising it). Various approaches to the communication and presentation of uncertainty have been developed, but not all are easy to understand by non-technical audiences, and they can also unexpectedly lead to misinterpretation.
The Third Assessment Report of the Intergovernmental Panel on Climate Change (IPCC, 2001) offered two forms of communication on uncertainties: the use of words to reflect different levels of certainty (probability or confidence), and the use of graphics (Moss and Schneider, 2000; Ha-Duong et al., 2007; Swart et al., 2009).

The verbal approach used a sevenpoint scale of terms of likelihood that a particular statement is true: extremely unlikely (<1%), very unlikely (1–10%), unlikely (10–33%), medium likelihood (33–66%), likely (66–90%), very likely (90–99%), and virtually certain (>99%). A similar, fivepoint scale was used for confidence, together with a quadrant depicting ‘‘level of consensus’’ and ‘‘amount of evidence’’. The more recent IPCC Guidance Notes (IPCC, 2005) and IPCC Working Group I Summary for Policymakers (IPCC, 2007) for the Fourth Assessment Report implement several changes, for instance, the ‘‘medium likelihood’’ label was replaced by ‘‘about as likely as not’’ (although this category was not applied in the main conclusions). Alternatives to the IPCC scale exist, for example, the twelve-point Weiss scale, which describes the level of certainty in terms of the degree to which evidence is convincing (Weiss, 2003, 2006).

Uncertainty scale based on legal standards of proof proposed by Weiss (2006) and its relation to the IPCC likelyhood scale.
The advantage of using words is that people are better at hearing/reading, using and remembering risk information described in words, rather than in numbers. However, using words results in loss of precision, and words have different meanings for different people (Wallsten et al., 1986), resulting in broad ranges of probabilities associated with each term by different members of the audience. On the other hand, this disadvantage may remedy the tendency of experts to be overly precise and underestimate the uncertainty associated with their own predictions (cf. Slovic et al., 1981).
Broad ranges and wordings may more accurately reflect the limited state of knowledge. A fixed scale’s consistent use of language (fixing probability terms to probability intervals) makes it easier to remember and consistent messages are perceived as more credible. A disadvantage is that a fixed scale does not match people’s intuitive use of probability language. As Patt and Schrag (2003) have shown, people translate such language by taking the event magnitude (severity of effects) into account. For example, an ‘unlikely’ hurricane is interpreted as less likely (in percentage of probability) than an ‘unlikely’ rain shower. This may result in an overestimation of the probability of low magnitude events and an underestimation of the probability of high magnitude events, when a fixed scale is used for communication. Problems appear to be most pronounced when dealing with predictions of one-time events, where probability estimates result from a lack of complete confidence in the predictive models. In general, the context of an issue influences the interpretation and choice of uncertainty terms.
Another issue concerning the use of scales is that it favours attention to quantifiable and probabilistic uncertainty. It is much harder to address ‘deep uncertainty’ (e.g., problem-framing uncertainty, methodological unreliability or recognised ignorance).
Surprisingly little research has been done on graphical communication, the mainexceptionbeing Ibrekk and Morgan (1987). Some general remarks can be made. Graphical communication has the advantage of conveniently summarising significant amounts of uncertainty information (Ibrekk and Morgan, 1987; Krupnick et al., 2006). Its major disadvantage is that most graphical expressions are not straightforward to understand. Especially when communicating with people who are not used to working with these expressions, this may become problematic. Policymakers prefer simple forms of communication, such as probability density functions (PDFs) and tables, rather than the complex graphics commonly used and favoured by analysts (Krupnick et al., 2006). Graphs can also easily mislead the user. In general, displays that explicitly contain the information that people are looking for, perform best. As with the verbal approach, communication of deep uncertainty seems difficult.
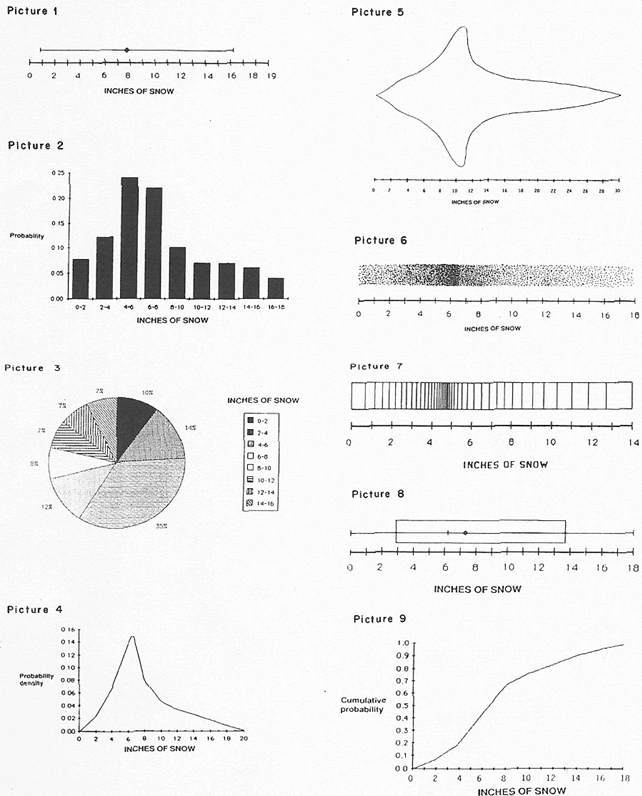
Examples of diffrent ways to present propabilistic information (Ibrekk and Morgan, 1987)
Wardekker et al (2008) explored the views, held by various parties in the Dutch science-policy interface hold, on uncertainty, uncertainty communication and its use and usefulness. Most participants preferred a quantifying approach to uncertainty. In this view, uncertainty is undesirable, but inevitable and science should quantify uncertainty and separate facts and values. However, in practice this is often difficult and unrealistic in complex issues where facts are uncertain, values in dispute and the stakes high. This means that there is amismatch between the degree of certainty that science can realistically deliver in such a situation, and what science is expected to provide. A large minority of the respondents opted for a deliberative view: uncertainty creates opportunities and puts the role of science into perspective.
Differences between scientists and policymakers in such perceptions of uncertainty and tensions, between what is expected from science and the limits to quantification of uncertainty, should be anticipated in communication strategies. Participants considered uncertainty information to be important to policymaking and the scientific and societal debate, but it should be concise and policy relevant. Policy relevance depends on, for example, the place of an issue in the policy cycle, novelty, topicality, controversiality, and several situation-specific factors. However, political interest is often limited, and uncertainty adds additional complexity and difficulty in daily practice (interpretation and use) and in negotiations, and the possibility of strategic use.
Participants had a broad interest in information on various types of uncertainty. They were particularly interested in uncertainty in (1) the environmental effects of policy, (2) reaching policy goals, and (3) the severity of environmental problems. Furthermore, they called for more uncertainty information on (4) topical issues, (5) issues on which there is little uncertainty communication at present, and (6) matters that are important for finding, selecting and prioritising policy responses. Specific information needs reported by participants included: sources and types of uncertainty, implications of uncertainty, and the phenomenon of recalculations.
Reflection on possible implications of uncertainty seems especially important, considering reported difficulties in interpretation and use of uncertainty information, lack of clarity on why it is important to be aware of (specific) uncertainties, and a strong perceived need for such information.
The use of probability terms – as is done by for instance the IPCC – is problematic, since differences in interpretation are large and context-dependent. The term ‘‘medium likelihood’’ for 33–66% probability seems especially problematic. Participants’ estimates for a direct Dutch translation varied greatly (median: 50–75%). Translations of the newly introduced terms ‘‘about as likely as not’’ (IPCC, 2005; IPCC, 2007) and ‘‘fifty-fifty; about 50%’’ (MNP, 2005) were also studied. The present study is the first to empirically assess these two new terms. The performance of both terms turned out to be fairly good (median: 40–60%), which implies that they could effectively to communicate what is meant.
Respondents were interested in information on the different sources of uncertainty that play an important role in a particular environmental problem. For instance, information on both projection-uncertainty and monitoring-uncertainty was found useful. The different types of uncertainty appeared to be relevant for assessing different policy questions. The monitoring-uncertainty is sometimes not communicated, as it is less relevant for relative policy goals. However, relative goals tend to develop into absolute goals, for which monitoring-uncertainty is relevant. Thus, it depends on the policy setting, first, which sources of uncertainty should be taken into account and, second, which sources of uncertainty could be aggregated.
Qualitative aspects of uncertainty are deemed relevant to policy. They can be communicated using a simple verbal ‘‘level of scientific knowledge’’ indicator or a more comprehensive graphical Pedigree Chart.

Example of a pedigree chart
Writers of environmental assessments should carefully consider where to place uncertainty information in the report. Information should be progressively disclosed depending on its relevance to target audiences. Crucial information (e.g. for interpreting how the report deals with uncertainty) should not be placed in often unread places, such as the appendices.
Most participants were positive about the amount and clarity of uncertainty communication in MNP’s Environmental Balance reports, but several suggestions for improvements have been made. These include the issues described in this article, as well as more specific suggestions, which can be found in the Dutch background documents.
Overall, a responsible communication of uncertainty information leads to a deeper understanding and increased awareness of the phenomenon of uncertainty and its policy implications. It is expected that this understanding and awareness may result in a more responsible, accountable, more transparent – and ultimately more effective – use of intrinsically uncertain science in decision-making.
Key Reference
J.A. Wardekker, J.P. van der Sluijs, P.H.M. Janssen, P. Kloprogge, A.C. Petersen, (2008). Uncertainty Communication in Environmental Assessments: Views from the Dutch Science-Policy Interface, Environmental Science and policy, 11, 627-641.
Further References
Ha-Duong, M., Swart, R., Bernstein, L., Petersen, A.C., 2007. Uncertainty management in the IPCC: agreeing to disagree. Global Environmental Change 17, 8–11.
Ibrekk, H., Morgan, M.G., 1987. Graphical communication of uncertain quantities to nontechnical people. Risk Analysis 7, 519–529.
IPCC, 2001. Climate Change 2001: Synthesis Report. Intergovernmental Panel on Climate Change. Cambridge University Press, Cambridge.
IPCC, 2005. Guidance Notes for Lead Authors of the IPCC Fourth Assessment Report on Addressing Uncertainties. Intergovernmental Panel on Climate Change, Geneva.
IPCC, 2007. Climate Change 2007: The Physical Science Basis — Summary for Policymakers. Intergovernmental Panel on Climate Change, Geneva.
Krupnick, A., Morgenstern, R., Batz, M., Nelson, P., Burtraw, D., Shih, J.S., McWilliams, M., 2006. Not A Sure Thing: Making Regulatory Choices under Uncertainty. Resources for the Future (RFF), Washington.
Moss, R.H., Schneider, S.H., 2000. Uncertainties in the IPCC TAR: recommendations to lead authors for more consistent assessment and reporting. In: Pachauri, R., Taniguchi, T., Tanaka, K. (Eds.), IPCC Supporting Material, Guidance Papers on the Cross Cutting Issues of the Third Assessment Report of the IPCC. Intergovernmental Panel on Climate Change, Geneva, pp. 33–51.
Patt, A.G., Schrag, D.P., 2003. Using specific language to describe risk and probability. Climatic Change 61, 17–30.
Slovic, P., Fischhoff, B., Lichtenstein, S., 1981. Perceived risk: psychological factors and social implications. Proceedings of the Royal Society of London, Series A, Mathematical and Physical Sciences 376, 17–34 1764.
Swart, R., Bernstein, L. Ha-Duong, M., Petersen, A., 2009. Agreeing to disagree: uncertainty management in assessing climate change, impacts and responses by the IPCC. Climatic Change 92(1-2) 1-29 .
Wallsten, T.J., Budescu, D.V., Rapoport, A., Zwick, R., Forsyth, B.H., 1986. Measuring the vague meanings of probability terms. Journal of Experimental Psychology: General 115, 348–365.
Weiss, C., 003. Expressing scientific uncertainty. Law, Probability and Risk 2, 25–46.
Weiss, C., 2006. Can there be science-based precaution? Environmental Research Letters 1 (1), 7 014003.